Most smart home dashboards start life the same way. You set up Home Assistant or a hub with a monitoring screen, let it add every device it discovers, and end up with a long scroll of toggles, temperatures and battery levels. It looks impressive for about a week. After that, everyone in the house drifts back to the phone apps and the light switches, and the tablet on the hallway wall turns into an expensive clock.
Companies ran into this wall long before home automation did, and the way they got past it translates surprisingly well to a house. When a business brings in BI and analytics services, the charts are usually the last thing to get built. The work starts with cleaning up the data and finding out which decisions people make every day, and the reports are shaped around those decisions. A home has far fewer decisions to make than a sales team, but the logic still holds. A useful dashboard helps you decide whether to run the dishwasher now or wait for the cheaper overnight rate, confirms the back door is locked without opening a camera feed, and shows why the upstairs bedroom always feels colder than the thermostat claims.
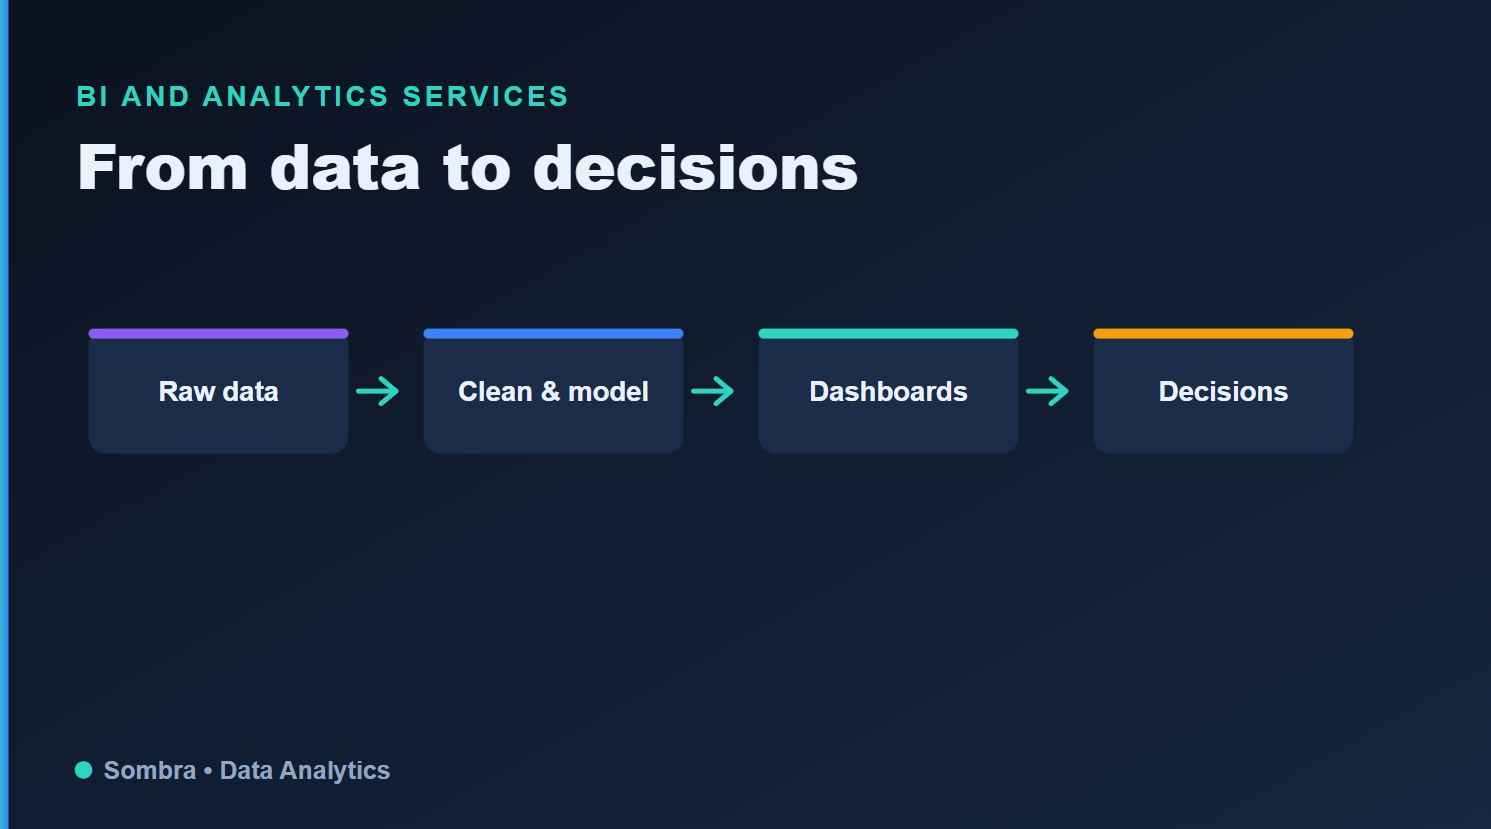
The same four steps apply at home, where sensor readings need tidying before they reach a dashboard and help you decide anything.
Clean up the data before you touch the cards
In business intelligence, the unglamorous layer underneath (integration, cleaning, consistent naming) decides whether anyone believes the numbers on screen. In a smart home, that layer is your hub and its entity list. Three temperature sensors called sensor.temperature_2, a smart plug that drops off the network every few days and a thermostat reporting twice, once through a cloud integration and once locally, will make any card built on top of them confusing, however good it looks.
A round of housekeeping pays off before you open the dashboard editor:
Rename entities by room and purpose, so "Kitchen fridge power" replaces whatever name the integration generated.
Assign every device to an area, which lets most platforms build room views for you.
Disable duplicate entities so the same device doesn't appear twice with slightly different readings.
Check how much history your system keeps. Home Assistant's recorder holds ten days of detailed history by default, while long-term statistics keep hourly summaries for supported sensors, so you can still compare energy use or heating across seasons.
Network reliability belongs in the same foundation. A card showing a reading from a sensor that went offline yesterday is worse than an empty card, because it looks current. If you're still choosing a controller, LinkdHOME's roundup of the best Z-Wave hubs compares options for people who want local control, including Hubitat Elevation and setups built around Home Assistant.
Translating BI ideas into rooms and devices
Most of the vocabulary from company reporting has a direct household equivalent. Thinking in these terms makes it easier to decide what earns a place on the main screen and what belongs one tap deeper.
| BI concept | What it means at work | What it looks like at home |
|---|---|---|
| Data foundation | Integrated, cleaned source data with consistent names | Renamed entities, devices assigned to areas, a stable Zigbee or Z-Wave mesh |
| KPIs | The handful of numbers that guide daily decisions | Today's energy use, temperature per room, door and lock status |
| Drill-down | Clicking a summary figure to see the detail behind it | Tapping a room tile to open that room's view with its history graphs |
| Governed metric | One agreed definition that every team uses | A single home or away status that every automation and view reads |
| Alerting | A notice when a metric crosses a threshold | A card that appears only when a window is open or a battery is low |
| Trend analysis | Comparing this period with the last one | Statistics graphs comparing this month's heating with last month's |
The alerting row is where many power users see the biggest improvement. The Home Assistant dashboard cards documentation lists history graphs, statistics graphs, gauges and an energy card, along with options to show or hide a card based on the user, the screen, the time or an entity's state. A dashboard that stays calm until a window is left open or a battery runs low gets read far more often than one that shows everything all the time.
Why So Many Home Dashboards Go Unused
The reasons mirror the ones BI teams see in offices. The most common is building around what's easy to display rather than what anyone needs to know. Integrations expose dozens of attributes per device, so it's tempting to put signal strength, firmware versions and uptime next to the lights. That detail is handy while you're troubleshooting and noise the rest of the time, so it belongs on a separate maintenance view.
Trust is the second problem. If the dashboard says the living room is 21 degrees and it plainly isn't, people stop looking. The culprit is often a sensor sitting in direct sun or next to a radiator, and moving it fixes the dashboard faster than any redesign would.
Then there's placement. A dashboard you have to remember to open on a laptop competes with every other habit in the house. The ones that stick tend to live where decisions happen, like a small tablet by the front door showing locks, lights and the weather, or a phone view that opens straight to the room you're standing in.
One Version Of The Truth For Everyone At Home
Self-service is one of the big promises of modern BI. People explore data on their own, but they do it on top of metrics defined once, centrally, so that "revenue" means the same thing in sales and in finance. Without that agreement, every team builds its own version of the numbers and meetings turn into arguments about whose spreadsheet is right.
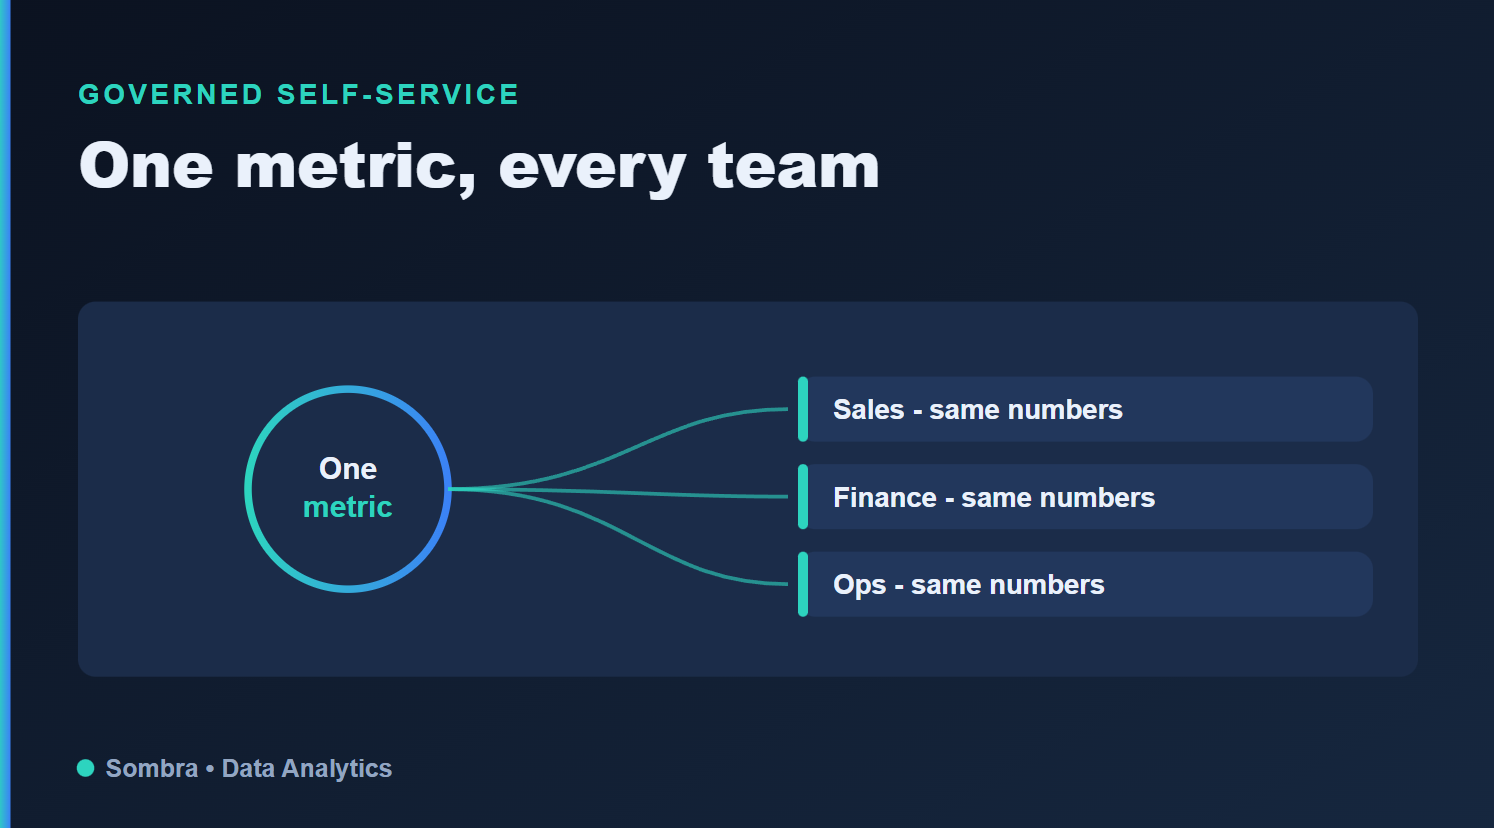
One shared definition feeding several views. At home, those views are the wall tablet, your phone and everyone else's.
A household runs into the same thing once several automations each decide for themselves whether anyone is home. One treats the house as empty when both phones leave, another waits for a motion sensor to time out, and the heating follows a third rule of its own. Defining home and away once, as a single helper or template that everything else reads, means the wall tablet, your phone and the heating schedule all agree. Energy cost works the same way: set the tariff in one place, and every card that shows spending uses it.
With those definitions settled, you can hand out simpler views. A partner or a teenager might only want lights, the thermostat and the front door, while you keep the detailed energy and maintenance views for yourself. Home Assistant lets you create several dashboards, and per-user card conditions let a shared dashboard show different things to different people without anyone touching the definitions underneath.
How to tell the dashboard is earning its place
Judge it the way a BI team would, by behavior rather than by how good it looks. Other people in the house check it without being reminded. Questions that used to mean opening three apps, such as whether the garage is closed or how much the heat pump used yesterday, get answered at a glance. The occasional argument about the thermostat gets shorter because everyone is reading the same number.
If none of that is happening, start from the decisions instead of the devices. Write down the five or six things people in your home check or change most often, build the main view around those, and move everything else into secondary views you open when something needs fixing.